Tuesday 10 December 2013

Noise, Mixing, Signal-to-noise ratio, and Filtering.

Noise, Mixing, Signal-to-noise ratio, and Filtering.

In this lab i will be learning how to create, mix and filter noises on goldwave. This lab will show the process of me mixing and filtering a track.

white noise created with a max volume of -20dB


Spectrum view of the white noise


wave with -10dB and a 1kHz amplitude zoomed in and showing 4 cycles


it does take the shape of a sine wave and yes i does take the form i would expect from this frequency?


mix of the wave and the white noise


spectrum of the mix


using the equalizer ive located the original wave tone by filtering the white noise out


spectrum of the original wave tone with the white noise filtered out


using the equalizer ive located the original white noise by filtering the wave tone out


spectrum of the white noise with the wave tone filtered out


At the end of this lab I've found out how to filter out different noises and mix different sounds using the equalizer and spectrum filter. The next lab will discuss more advance ways to mix audio and how music can compliment video using different skills.


Getting Familiar With Waves

Week 2:
In this lab i will be attempting these questions on wave-forms which will help me learn how to calculate the speed, wave length and frequency of sound.

Q1: In a recording room an acoustic wave was measured to have a frequency of 1KHz. What would its wavelength in cm be?

Answer: 
                                                                                       Formula:     v = f * λ

the sound in which the sound travels through the air is roughly 333m/s and we are told the frequency is 1kHz or 1000 Hz

therefore we can use the equation above to get the answer

λ = v / f

λ = 333 / 1000

λ = 0.333

there are 100 cm in a meter so we use this to convert our answer 

0.333 * 100

= 33.3 cm.


Q2: If a violinist is tuning to concert pitch in the usual manner to a tuning fork what is the likely wavelength of the sound from the violinist if she is playing an A note along with sound from the pitch fork


Answer:

the frequency of a A note on a violin is 440Hz as is a standard A tuning fork

the wavelength is

λ = v /f

λ = 333 / 440

λ = 0.756818181818181818181818.....

λ = 0.76 ~(2 Decimal Places)

because the two frequency's  are the same the to wave peaks will add together and the two troughs subtract from each other to give 880Hz and the wavelength of 

λ = v /f

λ = 333 / 880

λ = 0.378409090909090....

λ = 0.38 (2 Decimal Places)


Q3: If an acoustic wave is traveling along a work bench has a wavelength of 3.33m what will its frequency be? Why do you suppose that is it easier for this type if wave to be travel through solid materials?


Answer:

for the arguments sake lets assuming the work bench is made of hard wood, the the speed in which the sound will travel through it will be approximately 3600 m/s

now that we know the speed and the wavelength we can work out the frequency

 f = v / λ

f = 3600 / 3.33

f = 1081.081081....

f = 1081 (2 Decimal Places)

it is easier for this type of wave to pass through solid materials because the particles are closer togther meaning that as soon as the wave hits one particle it is more or less touching the next particle due to the particles being so close together where as when the waves travel through the air the particles are more spaced out so it would take long for the waves to reach each particle.

Q4: Sketch a sine wave accurately of amplitude 10, frequency 20Hz. Your sketch should show two complete cycles of wave. What is the duration of one cycle? What is the relationship between the frequency and the duration of one cycle?

f = 20Hz

t =  1 / f 
t = 1 / 20
t = 0.05


Q5: The topic “Standing Waves”. Write a detailed note explaining the term and give an example of this that occurs in real life. (Where possible draw diagrams and describe what represent)

Standing waves (or stationary waves) are made up as a result of the superposition of two waves with matching amplitude and frequency, which travel at the same speed, but in opposite directions of each other.

Q6: What is meant by terms constructive and destructive interference?

A constructive interference is when to waves have the same displacement they add together and make a bigger displacement. A Destructive interference is when to waves with different displacements add together which causes them to cancel each other out .


Q7: What aspect of an acoustic wave determines its loudness?


The loudness is measured in decibels (db)


Q8: Why are decibels used in the measurement of relative loudness of acoustics waves?

decibels are used to measure the loudness and intensity 

Q9: How long does it take a short 1KHz pulse of sound to travel 20m verses a 10Hz pulse?

t = v / d
t = 340 / 20
t = 17

there fore the time it will take is 17 seconds

Q10: Does sound travel under water? If so what effect does the water have?

Answer:


sound does travel through water rather than the air as the water molicules are much closer together so the vibrations pass through each other alot faster. where as air mollicules are further apart so it takes long for the vibrations to pass through each other.

Conclusion
At the end of this lab i have learned about how to calculate the speed, wave length and frequency of sound, how to measure in decibels and how fast speed travels through different materials and surfaces. next week i will be doing the lab: Audio Signal Processing – Generating Signals with GoldWave.


Audio Self Study

today i will be learning the fundamentals of sound this blog will cover these topics: Sound Fundamentals, Waveforms, Analog Audio, Digital Audio, Sampling Rate, Bit Depth and Digital Summary


Sound Fundamentals

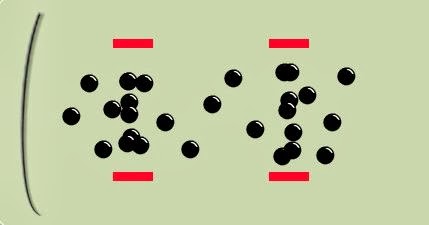
sound is created by vibrations such as strings on a intrument or vocal cords. these vibrations vibrate the air moicules forceing them into each other raising the air pressure, this cause an area of high pressure to move through the air shown in the picture below.


when these presure waves reach our ear it vibrates the reseptors and we hear it as sound.

when you see a waveform that represents soun the waveform acctually represents the presure waves. This is shown in the picture below.


the line in the midle of the wave is the point were the pressure is at rest the peak and trough of the wave is the high and low points of pressure.


Waveforms

the amplitude of a wave is the change in presure from the peak to the trough. the cycle of the waveform is the time taken to go from one point of the waveform all the way through the amplitude changes till eaches the same point again. the frequency of a waveform is the number of cycles it goes through each second such as 1 Hertz (Hz) = 1 cycle per second, 2Hz = 2 cycles per second and so on and so forth.


the wavelength is the distance between two points that have the exact phase. when two or more waves meet they are added and subtracted from each other if they have the same peaks and troughs the are said to be 'In Phase'. if this happens each peak adds to the other peak and each trough is subtracted from the other trough resulting in a waveform that has twice the amplitude of the origanal waveforms.


if the peaks in one wave matches up with another waves trough this is said to be '180 degrees out of phase' which mens that the peaks and troughs have canceled each other out.


in other cases where the waves are out of phase by a some other amount this will result in a more complicated waveform than the origanal ones. like the picture below


Analog Audio

a microphone works by taking the pressure and changing it in to changes in voltage, these changes in voltage match the changes in pressure waves of the origanal sound


a speaker works in the opposite of a microphone as it changes the voltage back into changes in pressure waves.


Digital Audio

in digital storeage computers break a waveform up into samples this is known as 'Digitizing or Sampling'


Sampling Rate

th sampling rate defines how offten a sample is taken eg: CDquallity sound has 44,100 samples persecond of the waveform. the higher the smapling rate, the higher the sound will be from the origanal.


Bit Depth

Bit Depth means it is the amplitude of the resolution. a CD has a bit depth of 16 bits, a bit is a digital value that can either be 0 or 1 so it can have up to 65,536 possible vaules for the waveform. A DVD has 24 bits or 16,777,216 possible valuse.

Digital Summary

a microphone converts a pressure wave into voltage variations ths is then changed again by sampling the signal as the sample rate and bit depth that is chossen this is done by a digital to analog converter such as a soundcard in a computer. to play the audio back the sound card reconstructs the sampling into a voltage signal again by connecting the samples together.

we also learned how to calculate the frequency, speed and wavelength  using a table 


this formula can be changed to work out speed (v), frequency (f) and wavelength (λ)

if your wanting to find the speed of sound you use the formula v = f * λ
if your wanting to find the frequency of sound you use the formula f = v / λ
if your wanting to find the wavelength of sound you use the formula λ = v / f

At the end of this lab i have learnt about the Fundamentals of sound Waveforms, Analog Audio, Digital Audio, Sampling Rate, Bit Depth and Digital Summary and the formula to calculate the speed (v), frequency (f) and wavelength (λ) of sound next week i will be doing the getting familier with waves lab.


RGB And HSL File Review

This blog will be looking at the RGB.exe and the HSL.exe to compare the two files to see which one is better at creating colours.After toying around with the the RGB.exe and HSL.exe files they are very similar as they are both ask you to match a random colour by moving slides around which control the 3 diferent colours in each file.

The RGB.exe file has Red, Green and Blue, this file is very easy to use. you start by either chooseing a colour on the panel to recreate that colour with the 3 sliders or to click on the panel to get a random to colour to recreate with the sliders. The HSL is basicly the same but instead of using red, green and blue like the the RGB file it instead uses hue, saturation and luminance which allows you to choose any colour you wanted. These options make it easier to recreate/ crate colours as they have a much wider range than red , green and blue.

In conclusion both of the files are very much the same as i stated above they both do there job that they were designed for but in my opinion the HSL.exe file is slightly better than the RGB.exe file as it has a better colours to recreate the colour in the panel, thanks to the use of hue, saturation and luminance.

Saturday 7 December 2013

Audio/Video Task

In this lab i will show how i can edit a video in moviemake and create then document what i have done in this blog.

For this task i used windows movie moviemaker to edit the video and goldwave to create the audio. as you can see from the link below i trimmed the video to show only the part where the camera man walks through the exhibition, as it is the only part which has a smooth flowing walk through the building. i choose to start with the title of the clip which then fades in from black to shows  to a pan down from the ceiling to reveal the show floor, to then move around the exhibition. I then chose to then finish on a exhibitions description as the clip then fades out to black.

For the audio i chose a simple funky/ upbeat rhythm to make the tour around the show floor more fun and uplifting. I started by searching the the website: www.freesound.org , and searched for a funky drum beat, when i found the one i wanted i created a new sound file lasting 1 minute.


I then mixed the drum beat to last the whole one minute file then i chose a funky bass line file to add to the file. I then added the bass line to file making sure that each second matches the drum beat. i didn't add any thing else as i didn't want the track to be overly complicated and ruin the flow of the video. Finaly i changed the volume to -15 dB as you can see in the picture below.


After loading the audio file into moviemaker i edited the video files volume so that the video has no sound to mix with the audio file i then added the audio to the edited video file, after making sure that it all fitted perfectly with each other i exported the file out and uploaded it to youtube.


If i was to ever do this task again i would make sure to have a professional video editing tool to use to make a better quality video and passably record my own track with my own instruments. part from that its went pretty well.

In conclusion I've shown my capabilities in editing a video and creating my own audio in moviemaker and goldwave such as trim, fade out, fade in and mixing then documented my process in this blog. The link to my video on youtube.com is provided below:


Manipulating Images Using Arithmetic


in this lab i will be learning how to manipulate  images using arithmetic in the GIMP program


loading the file into GIMP


the picture below shows artistic filter which makes the picture look more like a painting that enfasizes certain parts of the picture. there are many other filters you can use such as blur, distort and enhance.


the pictures below show 2 different convolution matrix and the changes that they will do to the original picture

3x3 of 's


although the picture is simular to the original this filter slitely distorts image and colour.


3x3 with 1's and -1's


this picture is alot more blurry than the original pucture it  looks like it has been taken with moving camera or a unfocused lense.


at the end of this lab i have learned the basics of  manipulating  images using arithmetic in GIMP. by using the filter in GIMP next week will be on video prossesing.


Examples for manipulating images with arithmetic - http://reference.wolfram.com/mathematica/guide/BasicImageManipulation.html


Audio Signal Processing – Generating Signals with GoldWave


Lab 3 Audio Signal Processing – Generating Signals with GoldWave.

in this lab i will learn how to add expressions and filters to audio in goldwave

the length for a 44100Hz sine wave and for i to display 8 cycles of 400Hz the duration should be 0.02 seconds. the image below shows this


the picture below shows a sine wave (f = Hz) which has a f value of 400


adding the fundamental tone with the expression of sine(2*pi*f*t)+sin(2*pi*3*f*t)/3+sin(2*pi*5*f*t)/5+sin(2*pi*7*f*t)/7+sin(2*pi*9*f*t)/9


using the spectrum filter you can see the wave is still turning into a square wave


adding the fundamental tone again with the expression sin(2*pi*f*t)+sin(2*pi*2*f*t)/2+sin(2*pi*3*f*t)/3+sin(2*pi*4*f*t)/4+sin(2*pi*5*f*t)/5


using the spectrum filter you can see the wave is still turning into a square saw-tooth wave


At the end of this lab i have learnt how to add expressions and filters in goldwave by using the expressions sin(2*pi*f*t) and and the spectrum filter. Next week i will be doing the lab: Noise, Mixing, Signal-to-noise ratio, and Filtering.

Goldwave Download - http://www.fileparade.com/listing/122376/GoldWave?gclid=COHLiv_tnrsCFQn3wgod1nkAPw

Goldwave Overview - http://www.youtube.com/watch?v=kWrTPOlWZrQ